

On 27 February 2024, Viking Therapeutics released results from a Phase 2 obesity trial. Its shares finished the day about 121% higher. On 25 November that year, Cassava Sciences announced that its Alzheimer’s drug had failed a Phase 3 study. Its shares fell roughly 84%. Both companies had experimental medicines, clinical teams and investors hoping for a breakthrough. The results took them in very different directions. [1,2]
These are deliberately dramatic examples, not typical returns to expect from a trial announcement. They show why understanding the science is part of understanding the investment. A biotech company can spend years building its case, then publish a few pages of results that force investors to reconsider almost everything they thought it was worth.
If you follow the sector, you see the phase numbers everywhere. A company starts Phase 1. Another reports positive Phase 2 data. A third describes its Phase 3 programme as pivotal. Those labels tell us something about the questions being asked and the evidence available. They do not tell us, on their own, whether a medicine works, whether it will be approved, or whether the shares are attractively priced.
To make sense of the journey, we need to follow the medicine from its first laboratory experiments through human testing, regulatory review and everyday use. Along the way, we also need to understand what companies measure, what they leave uncertain, and what investors may already have paid for. The regulatory examples here focus on the United States and the FDA.
Before Phase 1 there is still a great deal to prove
A treatment usually begins with an idea about biology: perhaps blocking a protein will slow a cancer, replacing a missing enzyme will restore a function, or altering a gene will reduce production of a harmful substance. Researchers test whether a candidate behaves as intended and investigate its potential toxicity. Preclinical work includes laboratory studies and, where appropriate, animal studies. It helps establish whether human testing is justified and informs the starting dose. [3]
That is valuable work, but an experimental system represents only part of a human disease. A striking result in cells does not establish that enough medicine can reach the right tissue in a person without causing unacceptable harm. Nor does an animal result settle how a treatment will behave in people taking other medicines or living with several illnesses. For an investor, the unanswered questions at this point are enormous.
In the US, the Investigational New Drug process, usually shortened to IND, is part of getting permission to begin human research. Permission to proceed is permission to investigate, not approval to sell a proven medicine. A trial protocol specifies the participants, treatment, measurements and analysis. Ethical review and informed consent help protect the people who volunteer. They remain people accepting uncertainty, even when a market headline describes them as a catalyst. [4,5]
You may also see Phase 0, sometimes called early Phase 1. These optional, very small exploratory studies can examine how a compound behaves in people, sometimes using tiny doses or brief exposure. They help researchers decide what deserves further testing; they are not designed to establish a treatment benefit. Most investors will encounter the familiar Phase 1 to Phase 3 sequence much more often. [6]
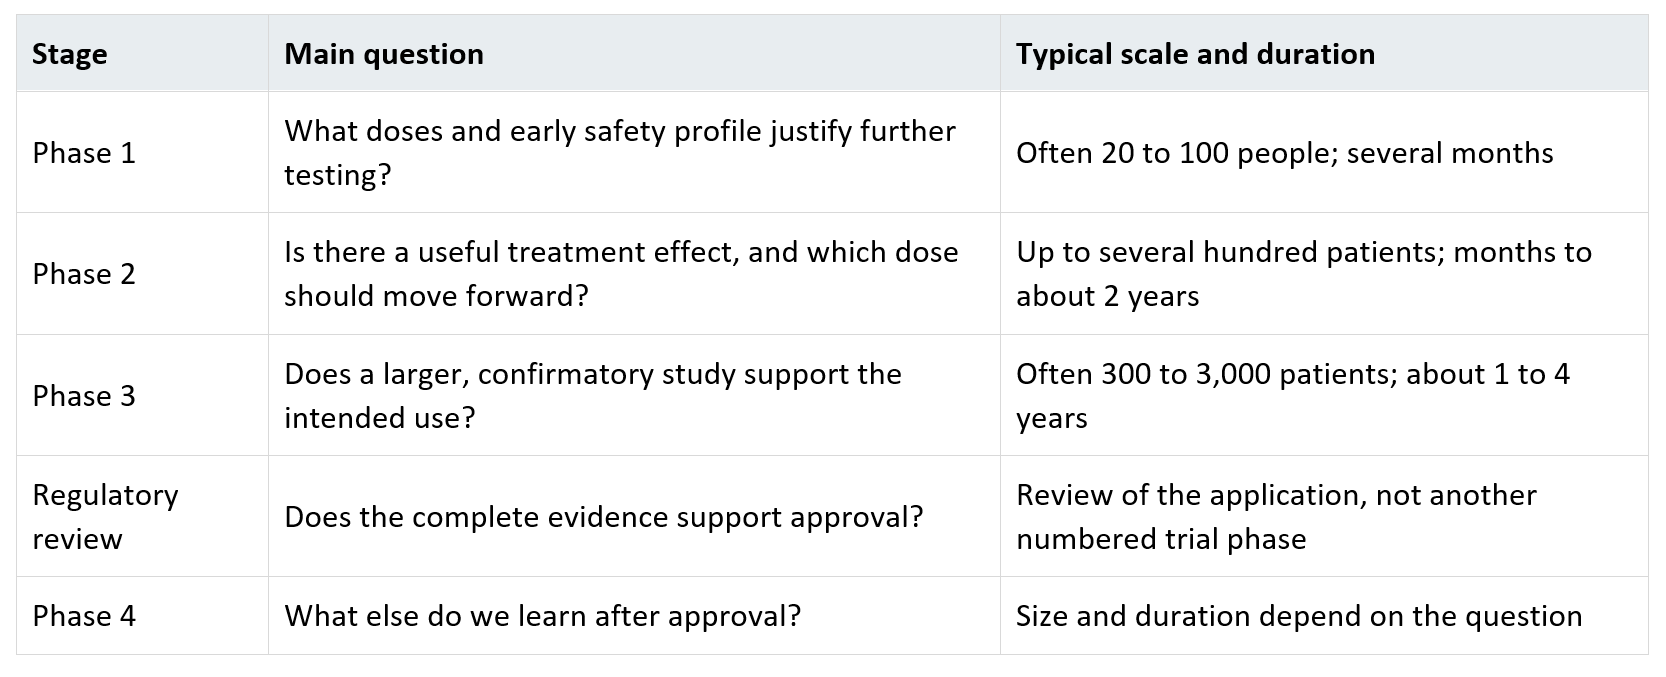
These are broad teaching ranges, not requirements or deadlines. Rare disease trials can be much smaller; major prevention studies can be much larger. Recruitment, follow-up and the number of studies needed also affect the full development timeline. [4,7]
Phase 1 establishes what can sensibly be tested next
Phase 1 usually gives us the first structured human evidence on a new candidate’s safety and dosing. Many programmes recruit healthy volunteers. Cancer trials commonly enrol patients with the disease instead, where the potential risks and possibility of benefit require a different balance. The aim is to learn enough to expose more people responsibly, while watching closely for problems. [4]
The terminology can sound more intimidating than the questions. Pharmacokinetics, or PK, concerns how the body handles the drug: how exposure changes over time, for example. Pharmacodynamics, or PD, concerns what the drug does to the body. A useful early study connects the dose to exposure, the intended biological effect and tolerability. You want a dose that can plausibly help, and that people can actually receive. [8]
Dose escalation means moving through dose levels under specified safety rules. Expansion cohorts then study selected doses or patient groups in more detail. Finding the highest tolerable dose is not always the same as finding the best dose. The FDA’s Project Optimus specifically encourages oncology development to consider efficacy, safety and tolerability together. More drug may produce more side effects without enough additional benefit to justify them. [8]

For investors, early human results can be surprisingly powerful. Intellia Therapeutics and Regeneron reported initial Phase 1 results for NTLA-2001 in June 2021. The treatment used CRISPR technology inside the body to reduce production of transthyretin, a protein involved in ATTR amyloidosis. The initial report covered just six patients. In the three receiving the higher dose, average blood TTR levels fell 87% by day 28. [9]
Intellia’s shares rose more than 50% on 28 June 2021. [10] My interpretation of that reaction is that investors saw evidence relevant to a wider technology platform, as well as one candidate. A method of editing genes inside the body could potentially underpin several treatments, so an early demonstration could change the value assigned to more than one programme.
Yet an 87% reduction in a protein did not mean an 87% improvement in the disease. Six patients and a short observation period could not settle long-term safety, durability or effects on disability and survival. That is the discipline required with Phase 1: recognise an important scientific advance while being precise about what it has actually established.
The same caution applies to an early cancer response. If two of five patients respond, that is 40%. If one additional patient responds, it becomes 60%. The arithmetic is correct in both cases, but such a small denominator makes the estimate unstable. Before getting excited, ask how many people were treated, how many were included in the analysis, how long they were followed and whether the responses were confirmed.
Phase 2 asks whether the treatment effect is worth pursuing
By Phase 2, the focus increasingly turns to whether the candidate helps patients with the intended condition. Researchers also continue to study safety and refine dosing. The proposed benefit might be fewer migraines, lower body weight, better movement, tumour shrinkage or improvement on a disease-specific scale. The precise question matters more than the phase label. [7]
A comparison group helps distinguish the treatment’s effect from changes that would have happened anyway. Randomisation assigns treatment by chance, reducing bias in who receives what. Blinding limits the influence of knowing the treatment assignment. A placebo is an inactive comparator, but placebo use does not necessarily mean withholding standard care: a study can compare a new drug plus standard treatment against placebo plus standard treatment. [5]
Consider a hypothetical pain trial. Patients taking the experimental medicine improve by three points. That sounds encouraging until you discover that the placebo group also improves by three points. The question is not simply whether treated patients felt better. It is whether the treatment caused an improvement beyond the comparison group, and whether that improvement was large enough to be useful.
Some studies are open label, meaning treatment assignment is known, or single arm, meaning there is no concurrent comparison group. Such results can still be informative, especially in serious diseases with few options, but comparisons with patients from an entirely different study carry extra uncertainty. Differences in disease severity, previous treatment and follow-up can easily make one candidate look stronger than another. [7]
Viking’s VENTURE trial illustrates why Phase 2 can have such a large financial impact. On 27 February 2024, the company reported that its injectable GLP-1/GIP candidate VK2735 produced mean weight loss of up to 14.7% from baseline after 13 weeks. The reported placebo-adjusted reduction reached 13.1 percentage points. Those are different measurements: the latter accounts for the change in the comparison group. The study met its primary and secondary endpoints. [11]
The results gave investors a reason to reconsider how competitive the candidate might become, helping explain the roughly 121% share-price rise mentioned earlier. They did not establish that it was superior to another obesity medicine in a direct comparison, or that 13 weeks of results guaranteed the same performance over a year. Longer treatment, larger numbers and the practical effects of tolerability still needed investigation.
You may encounter Phase 2a and Phase 2b. These commonly distinguish earlier exploration from more developed dose selection or efficacy testing, but the naming is not a universal quality scale. Combined Phase 1/2 and Phase 2/3 studies can link stages within one protocol. They do not make the unanswered questions disappear. Read which part of the study produced the result, rather than treating the largest number in its title as a certificate of certainty. [12,34]
Phase 3 tests whether the earlier promise holds up
Phase 3 usually provides larger, more definitive evidence for the proposed treatment use. A pivotal trial is one intended to provide key evidence for an approval application; the word describes its role, not a guaranteed result. Study size depends on the disease, the expected effect and what is being measured. An uncommon disease cannot necessarily supply thousands of eligible patients, while a study trying to prevent relatively infrequent events may need very large numbers. [7,13]

There are good reasons for a promising Phase 2 result to disappoint later. An early estimate may have been too optimistic. The later trial may recruit a broader population, use a different dose, run longer or measure a more demanding outcome. Background care may improve. A side effect that seemed manageable in a small study may become a bigger problem with longer treatment. These are reasons to scrutinise how the pivotal study differs from the evidence that originally attracted investors.
Cassava’s ReThink-ALZ trial provides a clear example of a late failure. On 25 November 2024, the company reported that simufilam had not met its co-primary endpoints in a randomised Phase 3 trial involving 804 people with mild or moderate Alzheimer’s disease. The study assessed cognition and daily functioning over 52 weeks. The company announced that it would discontinue its other Phase 3 study and its open-label extension. [14]
The roughly 84% share-price decline was a reminder that “already in Phase 3” does not mean “nearly certain to work”. Years of development had not removed the need to demonstrate the intended benefit in a controlled trial. For patients and families, the disappointment was far greater than a market loss; for investors, the central commercial assumption had been severely damaged.
There are successes too. Madrigal Pharmaceuticals reported positive Phase 3 MAESTRO-NASH results in December 2022, with resmetirom meeting both primary liver-biopsy endpoints. These assessed resolution of the inflammatory liver disease without worsening fibrosis, and improvement in fibrosis without worsening disease activity. Fibrosis means scarring. The disease was then commonly called NASH and is now called MASH. [15]
The FDA granted accelerated approval to resmetirom, branded Rezdiffra, on 14 March 2024 for a specified group of adults with noncirrhotic NASH and moderate to advanced fibrosis. The initial decision relied on biopsy-based evidence, with further work required to verify clinical benefit. That distinction is useful: a Phase 3 programme can support an accelerated approval, and an approval can still leave consequential questions to be answered. [16]
Reading the results beneath the headline
An endpoint is the measurement used to judge a trial’s outcome. The primary endpoint is central to the planned test of efficacy. Secondary endpoints answer additional questions. Exploratory analyses can generate useful ideas for future research, but they carry a different evidential weight. A company may find something encouraging even when the trial fails its main test, so begin with what was specified before the results were known. [17]
An especially tempting headline reports success in a subgroup after the overall study has disappointed. Perhaps younger patients, one dose or one geographic region looked better. Such findings deserve investigation, particularly when there is a biological explanation. They are also easier to find by chance when researchers make many comparisons. The FDA’s guidance on multiple endpoints addresses this problem: the analysis needs to control the risk of false positive conclusions. [17]
A p-value helps assess how compatible the data are with a specified null hypothesis, often that there is no treatment difference. A p-value of 0.03 means that, under that hypothesis and the analysis assumptions, a result at least as extreme would occur with probability 3%. It does not mean there is a 97% chance the medicine works. A threshold such as 0.05 also cannot be interpreted without knowing the trial’s testing plan, including adjustments for multiple comparisons. [18]
Statistical significance and clinical usefulness are separate judgements. Imagine a very large trial showing a reduction of one tenth of a point on a symptom scale. It might be statistically convincing yet too small for patients to notice. Conversely, a promising effect in a tiny trial may remain too uncertain to support a firm conclusion. A confidence interval helps show the precision of an estimate: a broad interval should make us less confident about its exact size. [32]
Percentages need similar care. In a hypothetical study, an event occurs in 10% of the comparison group and 7% of the treated group over the same follow-up period. That is a 30% relative reduction, but a 3 percentage point absolute reduction. Both are correct. They answer different questions, and the absolute figures help readers understand how many people actually benefited.
Cancer studies introduce several particularly important terms. Objective response rate, or ORR, is the proportion meeting predefined criteria for tumour response. Duration of response asks how long that response lasts. Progression-free survival, or PFS, measures time until progression or death. Overall survival, or OS, measures time until death from any cause. A complete response means no detectable tumour under the assessment criteria; it does not by itself establish a permanent cure. [13]
A high response rate is more persuasive when responses last, and a PFS improvement does not automatically establish an OS improvement. A hazard ratio is another comparison frequently reported in survival analyses. An estimated ratio of 0.70 is commonly described as a 30% reduction in the event hazard, subject to the model and its assumptions. It does not mean patients live 30% longer. Always check which event is being measured, the follow-up and the uncertainty around the estimate. [13]
Biomarkers need their own distinction. A blood protein, scan measurement or other biological indicator can show that a treatment is affecting its target. A surrogate endpoint is used in place of a direct clinical outcome because it is expected to predict benefit. The strength of that relationship varies: an established surrogate in one setting is not automatically validated for every medicine and disease. This is why moving a laboratory number can be important without settling whether patients feel better, function better or live longer. [19]
Finally, read the safety and missing-data tables. Look for treatment discontinuations, dose reductions, serious events and the balance between groups. An adverse event occurring during treatment is not automatically caused by the drug. “Serious” also has a specific meaning, including outcomes such as hospitalisation or death, and is not simply another word for an intense symptom. [33] Equally, “generally well tolerated” is an interpretation, not a substitute for the numbers. If the most encouraging efficacy analysis includes only patients who stayed on treatment, ask what happened to those who stopped and how the planned analysis handled them.
Follow-up matters just as much as the headline percentage. A response described as ongoing after two months tells us less about durability than one followed for two years. Interim results are an early analysis, not necessarily the final dataset. “Median not reached” means the data have not yet reached the point needed to estimate that median; it is not a promise that an outcome will never occur. Avoid turning incomplete observation into certainty.
The historical odds are sobering
The BIO, Informa Pharma Intelligence and QLS Advisors report covering 2011–2020 analysed 12,728 clinical and regulatory transitions across 9,704 development programmes. Its historical transition rates were: [20]
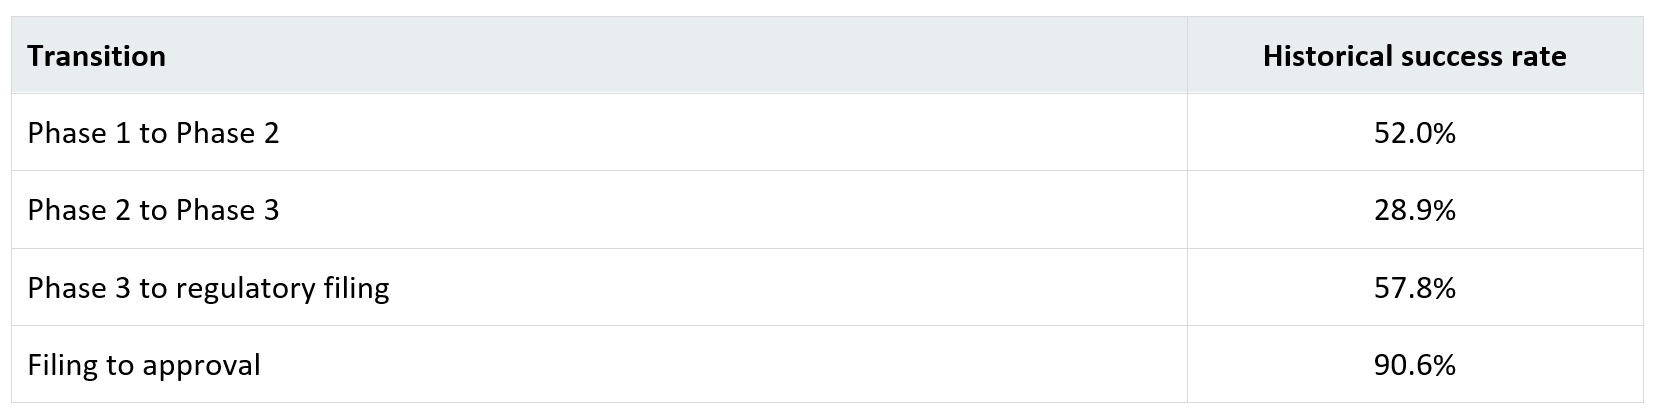
The estimated overall likelihood of approval from Phase 1 was 7.9%. Applying those rates to an illustrative 1,000 starting programmes gives roughly 520 reaching Phase 2, 150 reaching Phase 3, 87 reaching filing and 79 receiving approval. This is arithmetic using historical rates, not a tracked cohort or a prediction for today’s pipeline.
The filing figure includes resubmissions; it is not a 90.6% chance of approval on the first decision date. The report also found variation: overall approval likelihood from Phase 1 was 5.3% in oncology and 17.0% in rare disease programmes. Programmes using patient preselection biomarkers had a 15.9% likelihood. These are associations across different programme mixes, not proof that adding a biomarker doubles any particular drug’s chances. [20]
Use these figures as a starting point for questions. A well-understood mechanism, a reproducible effect and an appropriate patient population may justify a different assessment from a novel mechanism supported by a handful of uncontrolled observations. The generic success rate cannot perform that assessment for you. It also says nothing directly about the price at which a stock becomes attractive.
Approval and Phase 4 bring a different set of questions
After the necessary studies, a sponsor assembles an approval application. NDA stands for New Drug Application; BLA stands for Biologics License Application. The FDA reviews the evidence alongside issues such as manufacturing quality and the proposed prescribing information. A positive trial cannot compensate for every deficiency elsewhere in the application. [21]
The PDUFA date investors quote is a target action date, not a guaranteed approval date. A Complete Response Letter, or CRL, means the application cannot be approved in its present form. The practical consequences depend on the deficiencies: correcting a manufacturing issue is very different from conducting another large efficacy trial. Both can cost time and money. The final label also matters because it defines the approved use and may be narrower than investors anticipated. [21,22]
Several FDA programmes are often confused. Fast Track facilitates development and review for qualifying serious conditions and unmet needs. Breakthrough Therapy designation involves preliminary clinical evidence suggesting substantial improvement over available therapy and provides additional development support. Neither is a finding that a medicine is already proven or certain to be approved. [23,24]
Priority Review concerns the review timetable. The FDA describes a six-month action goal compared with ten months for standard review; applicable review-clock conventions and extensions matter when translating that into a calendar date. Accelerated Approval concerns the evidence supporting an earlier approval, often a surrogate reasonably likely to predict benefit. Required confirmatory work must verify that benefit, and approval can be withdrawn if it does not. These terms should never be treated as interchangeable. [25,26]
There is no universal requirement for every medicine to complete three neatly separate trial phases before approval. In some settings, earlier-phase studies can supply pivotal evidence, especially where substantial activity in a serious disease supports an accelerated pathway. Conversely, a Phase 3 label alone does not make a study adequate for approval. The evidence and the proposed use govern the decision. Approval for one patient group also does not automatically establish effectiveness in another. [7,13,26]
Research and monitoring continue after a medicine reaches the market. Phase 4 studies can investigate longer-term safety, effectiveness or use. Broader postmarketing surveillance also includes information outside formal trials. More widespread use and longer exposure can reveal problems that the original studies could not detect reliably. Approval establishes a favourable benefit-risk judgement for the authorised use on the available evidence; it does not establish an absence of risk forever. [27]
Merck’s Vioxx is a stark historical example. The company voluntarily withdrew it in September 2004 after the APPROVe study identified increased cardiovascular risk during prolonged use. The lesson is not that every approved medicine is hiding a similar problem. It is that evidence continues to accumulate, and a major safety finding can change the judgement about a product already being prescribed. [28]
Why the science and the share price do not move together neatly
There is no dependable rule that Phase 1 is worth a 20% rise, Phase 2 a doubling and Phase 3 something larger. Market impact depends on how the result changes expectations, how much of the company depends on the programme and what investors believed before the announcement. The same scientific finding can have very different consequences for a small company with one main asset and a large pharmaceutical group with established sales.

Imagine two companies developing the same hypothetical treatment. One is valued at $200 million and the other at $5 billion. Even if their scientific prospects were identical, the investment proposition would not be. The second valuation requires far more future value to justify what shareholders are paying. A cheap-looking share price is equally unhelpful without the share count: a $2 stock can represent a larger company than a $200 stock.
A simplified valuation example shows how probabilities can affect the arithmetic. Suppose the present value of a programme’s future commercial cash flows, conditional on success, is estimated at $1 billion. Assigning a 20% success probability produces a $200 million probability-weighted figure; raising it to 50% produces $500 million. This is an illustration, not a stock valuation. Development spending, financing, debt, cash, other programmes and the timing of different outcomes still need to be included.
It also explains why a medically positive result can disappoint investors. A study might clear its statistical threshold but show less benefit than expected, a less attractive dosing schedule or more discontinuations. Alternatively, a result could be excellent yet already largely reflected in the valuation. Investors are reassessing both the likelihood of approval and the size of the business that might follow.
Funding is part of that business. A published analysis of 138 pivotal trials supporting 59 FDA-approved medicines in 2015–2016 estimated a median direct trial cost of $19 million, with the middle half between $12.2 million and $33.1 million. This was a historical modelling study of pivotal trials, not a current price list and not the total cost of developing a drug. Discovery, failed programmes, manufacturing and the rest of a company’s operations are separate costs. [29]
For a company with $150 million in cash spending $25 million per quarter, simple division gives six quarters of runway. That is only an initial estimate. Spending may accelerate when Phase 3 begins, debts may become due and management will usually want funding in place before cash runs out. Having enough money to announce the next result is different from having enough to finish development and launch.
Success can therefore be followed by a share offering. Viking announced a proposed offering on the same day as its February 2024 results. [30] An offering brings money into the company while increasing the share count. It can reduce funding risk and strengthen the programme, even though existing owners hold a smaller percentage. Evaluate what the capital enables and the terms on which it is raised, rather than assuming every raise is either good or bad.
For a simple dilution example, issuing 25 million shares on top of 100 million increases the count by 25%. An investor who owned 1% beforehand would own 0.8% afterwards if they bought no additional shares. Their ownership percentage has fallen by 20%, not 25%. That does not mechanically imply a 20% fall in the share price, because the company has also received cash.
The commercial questions persist after approval. How many patients meet the label? Can the treatment be manufactured and delivered reliably? Will doctors use it, patients remain on it and payers reimburse it? How does it compare with the options available when it launches? A development programme can succeed scientifically while the resulting business falls short of the assumptions embedded in its share price.
What to check before trading a clinical result
Start by writing down what the next announcement can actually establish. First-patient dosing is progress in execution. Completion of enrolment reduces recruitment uncertainty. Neither demonstrates that the drug works. A data release is different, but its usefulness still depends on the study design and how much follow-up is available. Avoid assigning the same weight to every item in a company’s catalyst calendar.
Then read the trial record, the company’s original study description and, when available, the protocol and statistical analysis plan. Compare the reported primary endpoint with the one originally specified. Check the population, comparator, duration and analysis group. A press release is a useful starting point; a full presentation, regulatory review or scientific paper may reveal limitations that the headline cannot fit.
For the investment decision, set out at least three plausible outcomes: convincing success, an ambiguous result requiring more work, and failure. Estimate what each would mean for the remaining pipeline, financing and valuation. Those estimates will be imperfect, but putting them on paper exposes whether the thesis depends on everything going right.
A hypothetical share priced at $10 might be worth $15 after success and $3 after failure. At an assumed 60% probability of success, its simple two-outcome expected value is $10.20: 60% of $15 plus 40% of $3. That is only 2% above the starting price before timing and other complications. A high assumed chance of success has produced a thin expected return because the downside is so severe. Changing the assumptions changes the answer; that is precisely why they should be explicit.
Position size deserves the same attention as the thesis. If a position is 5% of a portfolio and falls 80%, the direct portfolio loss is 4%, assuming everything else stays unchanged. At a 25% position weight, the same fall costs 20% of the portfolio. A stop order cannot guarantee the intended exit price when a stock gaps sharply after news. The amount exposed before the announcement matters. [31]
And a good result does not oblige you to buy the first spike. Once the shares have doubled, the entry price and remaining upside have changed. Waiting for the full dataset, a financing announcement, consolidation or a pullback can produce a different decision from buying into the initial excitement. There is no requirement to own every successful medicine’s developer, particularly at a price that leaves little room for disappointment.
When the next biotech headline arrives, try to describe it without the company’s adjectives. State what was tested, in whom, against what, for how long and with what result. Then say what remains unknown and what the current valuation assumes. If you can do that clearly, you are in a much better position to decide whether the announcement has changed the investment case, or simply made an already expensive possibility sound more exciting.